Residential
Residential Installation Count

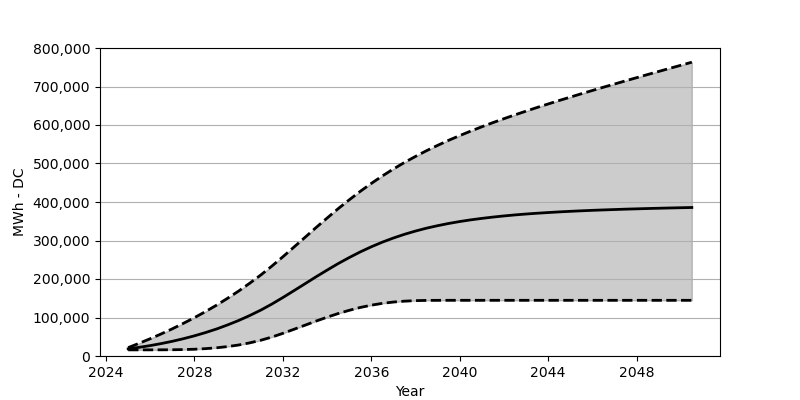
Residential Solar Generation
Wenbin Zhou and Shixiang Zhu
Carnegie Mellon University
Email: wenbinz2@andrew.cmu.edu; shixiangzhu@cmu.edu
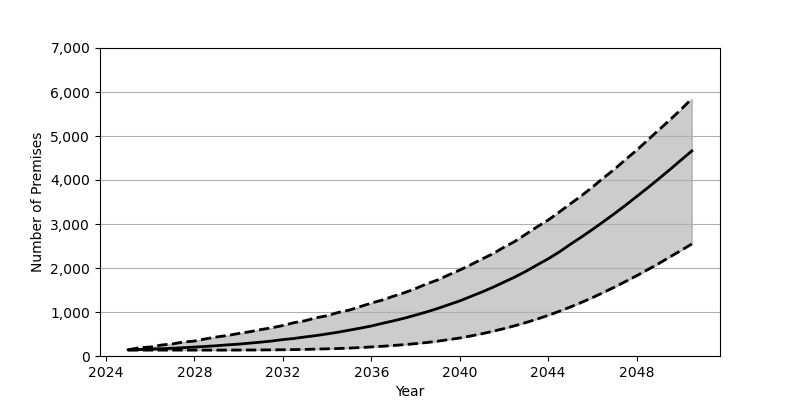
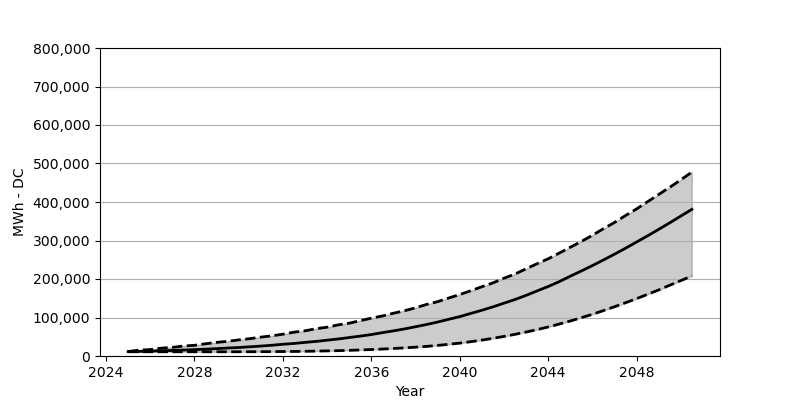
For PV forecast, we adopt a bottom-up forecast approach using the PV installation record data, therefore there are two sets of hyperparameters, each corresponding to the residential and commercial sector. Additional information include load, outage, demographic factors (e.g., education, income) are used to assist model fitting. Same assumptions as the IRP 2022 report was used for computing the generation forecast. The details of our methodology can be found in the preprint [1].
The initial values of the hyperparameters are fitted in a data-driven manner. We include some additional supporting arguments to help with model adjustment:
Confidence level: Due to large residential PV installation demand, larger uncertainty is equipped with the forecast, so it is recommended that a relative large confidence level to be chosen (e.g. 90%). On the other hand, only very few installations have been historically executed for commercial installation, so we can reasonably adopt lower model confidence for more informative low and upper bounds (e.g. 10%).
Tipping point: Shining Cities' most recent solar energy survey (2022) [3] show that Indianapolis ranks 12th in the nation for total solar capcity, making it a solar superstar city. In the meatime, SEIA's most recent solar market insight report (2024) [2] forecasted that both residential and commercial PV capacity exhibit increasing growth (2024-2029) for the US market. These evidence suggest that Indianapolis is positioned at a solar market with strong adoption surge, and the tipping point will likely not come before 2029. Looking at policy factors, recently the federal investiment tax credit (ITC) has been amended with the Clean Electricity Investment Tax Credit (CEITC), which will remain effective until 2032 [3]. Some regional level incentives, such as the Indiana Senate Enrolled Act 309 remains effective for generators installed until 2047 [3]. Therefore, we reasonably hypothesize that the tipping point will not arrive before 2032.
Penetration rate: We hypothesize that the theoretical penetration will reach no lower than the current highest tier PV penetration level. Our model result (7% for residential and 4% for commercial) sum up to more than 1.5 times the current PV penetration rate of the state of California. It is notable that our model shows that the saturation effect for commercial sector is not salient before 2050, suggesting a long-lasting potential for customers in the commercial sector.